Technology
 Education and training
 Web Development and UI / UX
 Healthcare/Medical
 Logistics and Supply Chain
 Information Technology
 Insuretech and Financial Services
 Marketplaces
 Software Development
 E-commerce and retail
 AI and Machine Learning
 Energy and Solar
 Security and Surveillance
 Digital Marketing Agency
 Transportation
 MSP
MSP
 Telecom
 B2B SaaS
 Cybersecurity
 HR tech
 Fintech
 Cleantech
 Consulting
B2B Digital Marketing Benchmarks 2026: ROI Metrics & How Top Teams Outperform
Major Takeaways: B2B Digital Marketing Benchmarks
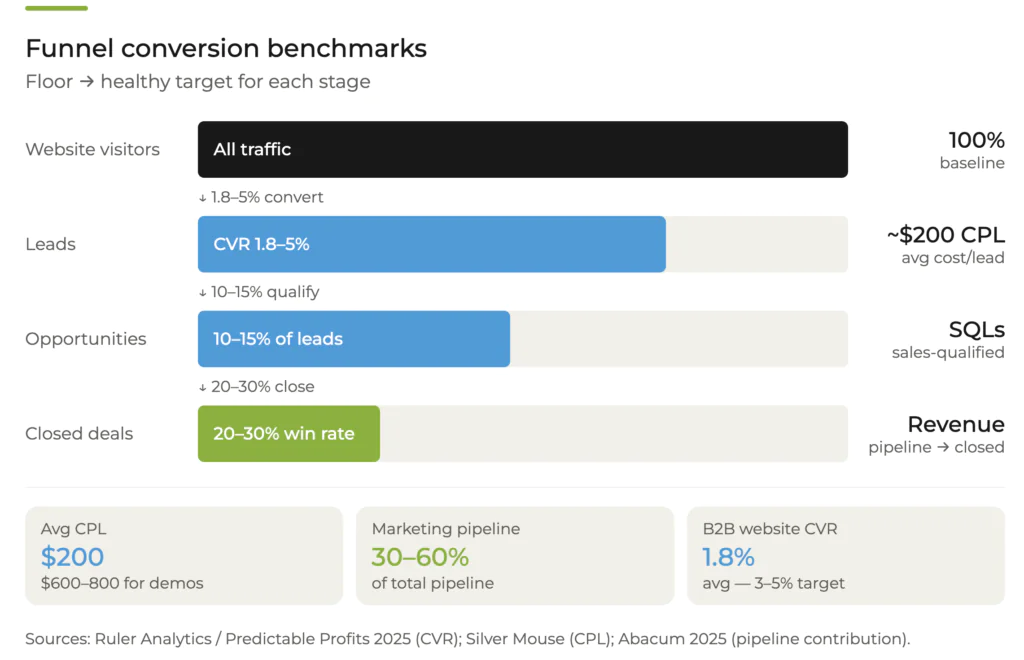
The average B2B website conversion rate is approximately 1.8%, with a healthy target range of 3–5%. Top-performing landing pages with highly targeted traffic can exceed 10%, depending on offer quality and traffic source.
The average cost per lead (CPL) in B2B is ~$200, though demo request CPLs can reach $600–$800 depending on lead quality and channel. LinkedIn typically drives the highest CPL; email and SEO the lowest relative to lead value.
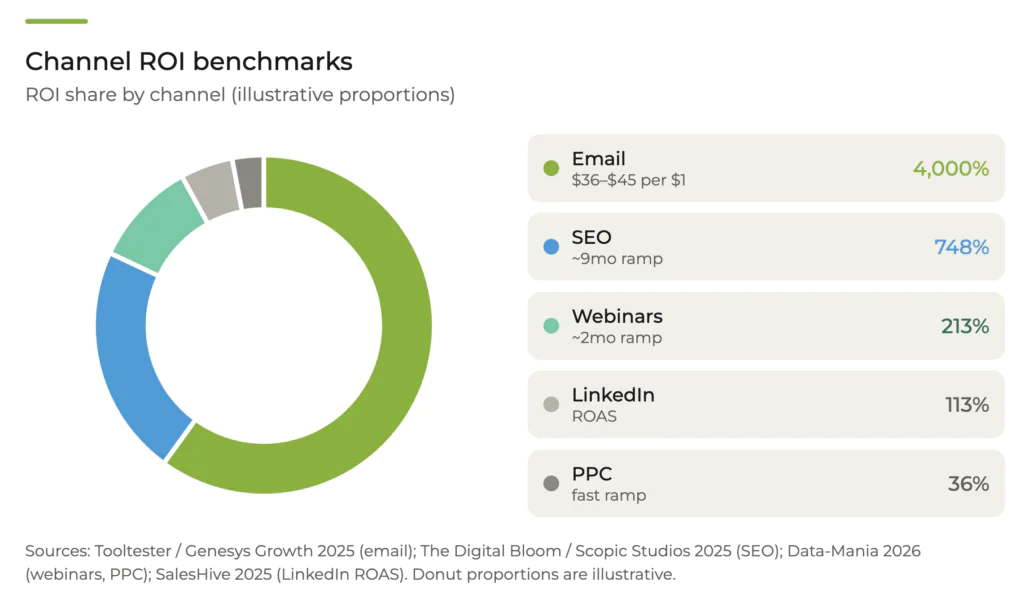
Email marketing leads in ROI, returning $36–$40 per $1 spent, followed by SEO and content marketing with thought leadership campaigns delivering ROI exceeding 700% over a 9-month window.
Marketing-sourced pipeline should contribute 30–60% of total revenue targets. Strong programs also convert 10–30% of MQLs to SQLs, with top teams pushing toward the upper end.
Leading B2B teams combine ABM, AI-driven targeting, and intent data to personalize at scale. Companies using ABM are 60% more likely to meet revenue goals and allocate an average of 18% of their marketing budget to account-based programs.
Benchmark data grounds budget planning in reality. If CPL is $200 and you need 1,000 leads, that’s $200K in spend required. B2B organizations invest an average of 7.7–8.4% of revenue in marketing, with high-growth SaaS companies often exceeding 10–15%.
If your conversion rate is consistently below 2%, your MQL-to-SQL rate is under 10%, or marketing sources less than 30% of pipeline, treat these as structural problems, not execution issues. Optimize targeting, messaging, and qualification criteria before spending more.
Gartner projects traditional search volume will drop 25% by 2026 as buyers shift to AI-powered tools. B2B teams now need to track AI citation and visibility alongside traditional SEO metrics, a new benchmark category that top performers are already measuring.
Introduction
90% of B2B marketing teams now report on ROI (2), yet reporting on it and actually improving it are two different things. Top-performing organizations embrace data-driven strategies – for instance, B2B marketers using account-based tactics achieve 81% higher ROI than their peers (3). What sets these leaders apart? It starts with knowing which B2B digital marketing benchmarks to track and how to leverage those metrics for maximum return.
This guide breaks down the key ROI benchmarks for B2B marketing heading into 2026. We cover the metrics that define a healthy funnel, from website conversion rates and cost per lead to channel-specific ROI across email, SEO, paid media, and social, and explain how leading teams consistently outperform the averages.
We also address a benchmark category that most guides still ignore: AI search visibility. With traditional search volume projected to drop 25% by 2026 (16) as buyers shift toward AI-powered tools, teams that only track clicks and rankings are measuring an incomplete picture.
We compiled this guide by reviewing leading industry reports, cross-referencing benchmark data across multiple credible sources, and interpreting the findings through Martal’s experience running outbound lead generation and pipeline programs across 50+ B2B verticals. The goal is straightforward, give revenue-focused leaders the context to answer the question, are our numbers good, and where do we go from here?
Why B2B Digital Benchmarks Matter for ROI
54% of companies using marketing analytics report above-average profits.
Reference Source: Amplitude
54% of companies that heavily use marketing analytics report higher profits than average (13). In other words, businesses leveraging benchmarks and analytics tend to outperform – but many B2B teams still struggle to turn data into action. So, why are B2B marketing benchmarks so critical for ROI?
At their core, benchmarks are reference points. A B2B digital marketing benchmark is a standard metric (e.g., an average conversion rate or cost per lead) that lets you gauge your performance against others in your industry (7). If your website converts at 1.5% and the benchmark for your category is 3%, that gap tells you something specific is broken, and where to look first.
Benchmarks remove the guesswork from performance reviews. They answer the question every CMO and CRO eventually has to answer: “Are these results actually good?” That’s a harder question than it sounds when leadership is pressing for justification and every channel claims credit for the same revenue.
But before we dive in, it’s important to note that technical infrastructure often goes overlooked when discussing marketing benchmarks, yet it directly impacts every metric you track. Slow site speeds hurt conversion rates regardless of brilliant campaigns. Downtime during critical launches costs opportunities. Investing in quality web hosting ensures your digital marketing efforts perform as intended. Reliable hosting maintains fast page loads that reduce bounce rates, handles traffic spikes from successful campaigns without crashes, and provides consistent uptime that keeps landing pages accessible.
Your marketing benchmarks depend on technical foundations that support them. Infrastructure failures undermine even well-executed strategies.
In B2B, benchmarking is especially important because the sales cycles are longer and the stakes are higher. A single B2B lead can represent a multi-year, high-value contract – so inefficient marketing isn’t just a minor slip, it’s a serious revenue loss. Benchmarks help you focus on the ROI metrics that matter. Rather than chasing vanity metrics (impressions, basic clicks) that don’t correlate with growth, top teams zero in on benchmarks tied to pipeline and revenue.
For example, instead of bragging about website traffic alone, they look at what percentage of that traffic converts into sales-qualified leads (SQLs) and ultimately closed deals.
Moreover, benchmarks inform planning. Knowing typical conversion rates and costs allows you to forecast how many sales leads or opportunities you need to hit revenue targets. They also foster alignment between marketing and sales – a notoriously tricky interface in B2B. If marketing is expected to generate, say, 30–60% of the sales pipeline (12), benchmarks for lead volume and quality ensure both teams agree on what “good” looks like.
It’s also important to note that B2B vs B2C benchmarks can differ significantly. B2B marketing usually targets niche audiences and involves multiple decision-makers, so conversion rates tend to be lower and cost per lead (CPL) higher than in B2C. (For instance, B2B email campaigns convert at ~2.4% vs 2.8% in B2C on average (4), and B2B leads often cost around $200 each (7) while B2C leads can be much cheaper.) These differences make having B2B-specific benchmarks crucial – you don’t want to measure your enterprise software campaign against the metrics of a mass-market consumer product.
In short, benchmarks matter because they connect your marketing metrics to business outcomes. By benchmarking, you can confidently answer: Are we getting strong ROI on our marketing spend? Where should we improve? How do we compare to the competition? The next sections will delve into the key B2B digital marketing benchmarks every ROI-focused leader should know.
Key B2B Digital Marketing Benchmarks & ROI Metrics for 2026
B2B companies pay around $200 per lead on average (7) and the average B2B website converts at just 1.8% of visitors (17), well below what most teams assume when setting pipeline targets. These numbers set the baseline for what the benchmarks in this section are measuring. Use them as guideposts, not ceilings. Top teams treat the industry average as a floor to clear, not a target to hit.
The sections below cover four benchmark categories, funnel conversion, channel ROI, engagement efficiency, and AI search visibility, highlighting key performance metrics across the B2B funnel, from lead generation to emerging trends.
Funnel Conversion & Lead Generation
- The average B2B website converts at 1.8% of visitors — lower than most teams assume when setting pipeline targets. A healthy target is 3–5%; top-performing landing pages with tightly matched traffic exceed 10% (35)
- For B2B companies with higher average contract values (typically above $5K ACV), 1.5% is common, 3% is good, and 5%+ is genuinely strong — treat anything below 1.5% as a targeting and messaging problem before adding spend (35)
- The average cost per lead (CPL) across B2B industries is approximately $200, with demo request CPLs reaching $600–$800 for B2B tech companies (7)
- LinkedIn Ads typically produces the highest CPL (often $300+); email and SEO produce the lowest relative to lead quality (7)
- Most B2B organizations find that ~10–15% of raw leads become qualified opportunities — this rises with stronger ICP targeting and lead qualification frameworks (7)
- Opportunity-to-close rates typically run 20–30% depending on sales effectiveness and deal complexity
- Marketing-sourced pipeline should contribute 30–60% of total pipeline — if below 30%, it usually signals underinvestment, a qualification problem, or outbound carrying too much of the prospecting load without support (12)
Channel ROI Benchmarks
- Email marketing returns $36–$45 for every $1 spent — the highest ROI of any B2B digital channel, driven by low distribution costs and the ability to precisely target content (14)
- 42% of B2B marketers rank email as their most effective channel for lead generation and nurturing; 73% of B2B buyers say email is their preferred channel for vendor communication (20)
- SEO and thought leadership content deliver 748% ROI with approximately a 9-month breakeven period — organic search still accounts for ~29% of total B2B website traffic, the largest single traffic source (22)
- B2B SaaS companies in one analysis saw ~702% ROI from SEO within 7 months; more broadly, businesses earn an average of $22 in revenue for every $1 spent on SEO (6)
- Webinars deliver ~213% ROI on average — the value is in intent, as registrants self-select as interested, making post-event conversion easier than cold outreach (33)
- PPC campaigns return approximately 36% ROI in the short run — modest compared to email or SEO, but valuable for speed and account-level precision (33)
- LinkedIn Ads is the only major B2B paid platform currently delivering consistently positive ROAS (~113%) — making it the paid channel most worth defending in budget reviews (37)
- Google Search Ads average a 3.04% conversion rate at a CPC of approximately $2.69; LinkedIn Ads convert at ~1.5–4.0% at CPCs of $5–6; Facebook/Meta Ads convert at ~10.6% for lead gen offers at a CPC of ~$1.72 (7)
Email Engagement Benchmarks
- Industry average email open rate: ~42–43% — note that Apple Mail Privacy Protection (MPP) inflates this metric by pre-loading emails for approximately 46% of email clients; use click-through rate and click-to-open rate as primary engagement indicators (39)
- Average email click-through rate (CTR): ~2.0–2.1% across industries; B2B technology specifically benchmarks at ~2.5% (34)
- Average click-to-open rate (CTOR): ~6.8% — the more reliable post-MPP engagement metric (39)
- Unsubscribe rate below 0.5% per campaign is considered healthy; spikes above that signal frequency or relevance issues
- B2B email campaigns convert at an average of 2.4% — compared to 2.8% for B2C (4)
Engagement & Sales Efficiency Benchmarks
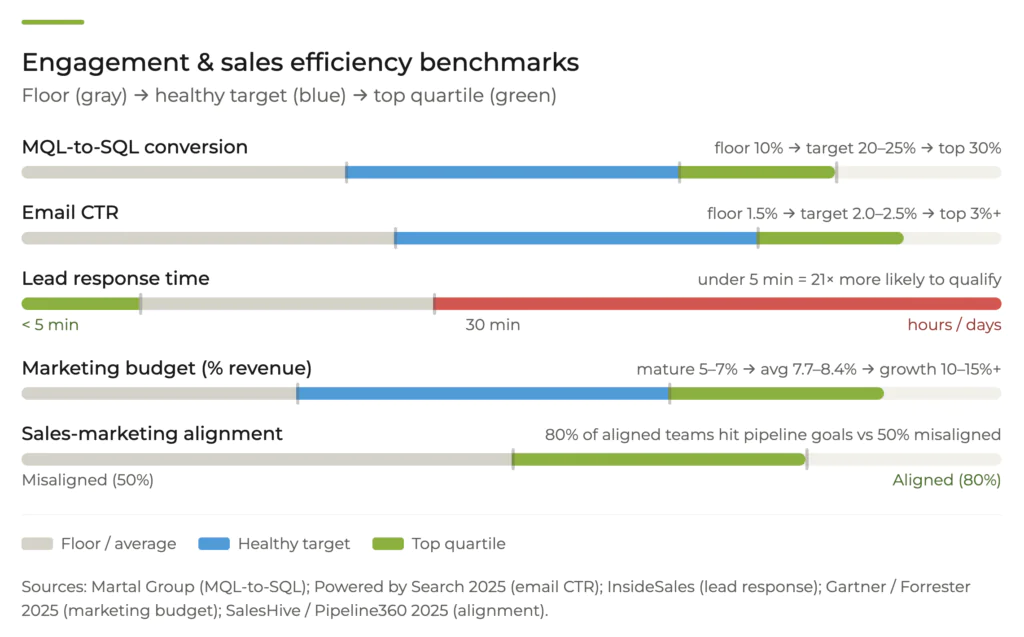
- High-performing B2B teams convert 10–30% of MQLs into sales-accepted leads (SQLs) — if below 10%, the root cause is almost always misaligned ICP definitions or low-intent lead generation (15)
- A lead contacted within 5 minutes is 21x more likely to qualify than one contacted after 30 minutes — response time is a structural problem, not a motivational one (24)
- B2B marketing budgets average 7.7% of total company revenue in 2025 — flat from 2024 and still below pre-pandemic levels; 59% of CMOs report their budget is insufficient to execute their full strategy (25)
- 93% of marketers say fully aligned sales and marketing teams are vital to ABM success — teams with strong alignment are 80% more likely to hit pipeline goals, versus 50% for misaligned teams (37)
- 54% of companies that heavily use marketing analytics report above-average profits (13)
AI Search & AEO Benchmarks
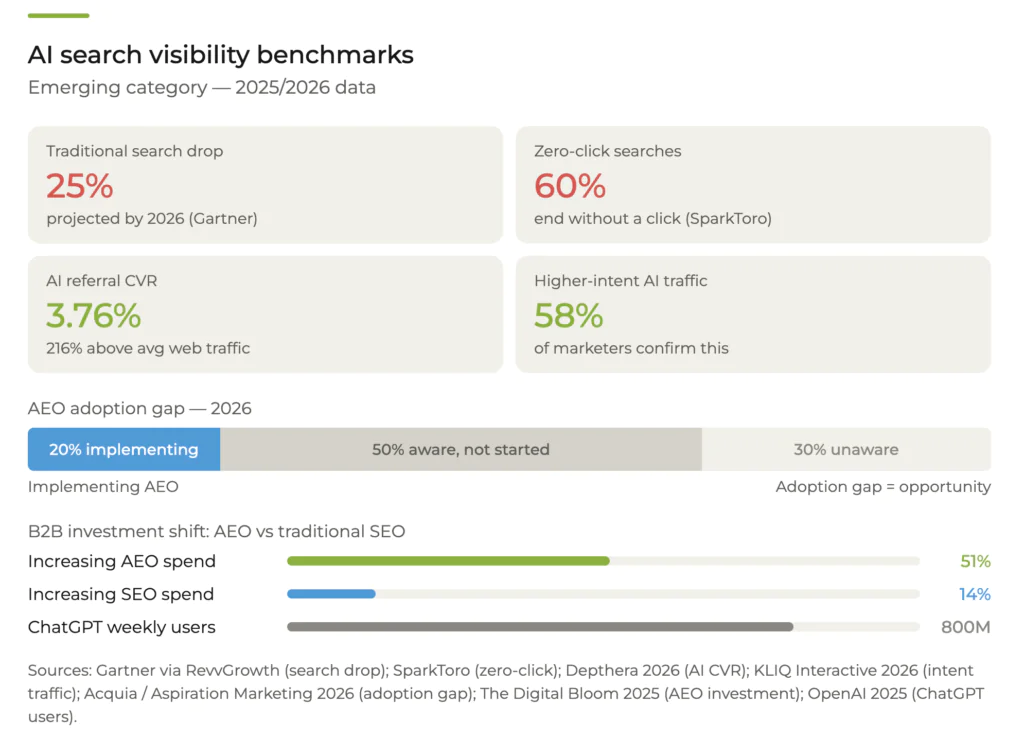
- Gartner projects traditional search engine volume will drop 25% by 2026 as users migrate to AI-powered tools — with 60% of searches now ending without a single click to an external website (28)
- ChatGPT reached 800 million weekly active users by October 2025 — up from 300 million in December 2024, a 2.6x increase in under a year (27)
- 49% of B2B marketers report declining traditional search traffic due to AI-generated answers; 58% say AI referral traffic converts at significantly higher intent than standard organic traffic (29)
- AI referral traffic currently converts at an average of 3.76% — approximately 216% higher than standard web traffic — because AI users are typically further along in the buying decision when they click through (30)
- 70% of marketers believe AEO will significantly impact their strategy in 2026, yet only 20% have begun implementing it — the adoption gap is still wide enough to represent a meaningful competitive opportunity (31)
51% of B2B companies plan to increase Answer Engine Optimization (AEO) investment in 2025/2026, compared to only 14% increasing traditional SEO spend (22)
Funnel Conversion & Lead Generation Benchmarks
B2B conversion rates in 2025 averaged 2.9%, ranging from 1.1% in SaaS to 7.4% in legal.
Reference Source: Predictable Profits
Attracting traffic is only half the equation, converting that traffic into sales-ready leads and customers is where ROI is won. Conversion benchmarks help you measure how efficiently prospects move through your marketing funnel:
- Website conversion rates (visitor to lead): The average B2B website converts at approximately 1.8%, lower than many teams assume, and lower than figures often cited from older benchmarks. For B2B companies with higher average contract values (typically above $5K ACV), 1.5% is common, 3% is good, and 5%+ is genuinely strong (18). For example, landing pages for Google search ads convert around 3.0% on average, whereas an organic social visit might convert below 2%. Across channels, a 2–5% rate is a common benchmark. If your site is consistently below 1.5%, treat it as a targeting and messaging problem before adding more spend. Top-performing pages with tightly matched traffic and strong CTAs can exceed 10% — but that requires continuous testing, not a one-time setup.
- Cost Per Lead (CPL): B2B leads are valuable – and expensive to acquire. The average CPL in B2B is about $200 though the range is wide by channel and lead type (14). A gated content download will cost far less than a demo request; cost per demo request for B2B tech companies typically falls between $600–$800 (7). As a channel comparison: LinkedIn Ads tend to produce the highest CPL (often $300+), while email and SEO produce the lowest relative to lead quality. The goal is not to minimize CPL in isolation, it is to ensure that customer lifetime value meaningfully exceeds acquisition cost at every channel level. If your CPL is above benchmark without a proportional lift in deal size or close rate, that is a targeting or qualification problem worth solving.
- Lead-to-opportunity and opportunity-to-close conversion: Raw leads are a starting point, not a result. The percentage of leads that progress to a true sales opportunity (SQL) is a more meaningful benchmark.
Most B2B organizations find that ~10–15% of raw leads become true qualified opportunities, though this rises with stronger lead qualification frameworks and better ICP targeting. Opportunity-to-close rates typically run 20–30% depending on sales effectiveness and deal complexity. If your lead-to-SQL rate is significantly below 10%, the issue is usually one of two things: marketing is generating low-intent leads, or sales and marketing are working from different definitions of “qualified.” Either way, the fix starts with lead nurturing alignment, not volume.
- Marketing pipeline contribution: In mature B2B marketing operations, marketing is expected to source roughly one-third or more of the sales pipeline. The standard benchmark is 30–60% of pipeline attributed to marketing, with the remainder coming from outbound sales and partner channels (12). If marketing is currently sourcing less than 30%, it often signals underinvestment in demand generation, a qualification problem that is washing out otherwise good leads, or misalignment where outbound sales is carrying too much of the prospecting load without the right support. Top teams track marketing-sourced pipeline $ and % as a KPI and benchmark it against that ~50% ideal range – using it to advocate for budget or headcount.
A note on industry context. A niche industrial manufacturer might naturally have a lower website conversion rate than a broad SaaS tool, not because the program is failing, but because the addressable audience is smaller and the buying cycle longer. Always compare against peer benchmarks in your sector where possible. If available, drill into benchmarks for your industry (e.g., software vs. professional services) and company size. Enterprise-targeted programs typically carry higher CPLs than SMB-focused campaigns; that is expected, not a red flag. The benchmarks are most useful when tracked over time against your own baseline, not just as a one-time comparison against an industry figure.
B2B Marketing ROI Benchmarks by Channel
Email marketing delivers an averageROI of $36–$45 for every $1 spent.
Reference Source: Tooltester
When it comes to return on investment, not all marketing channels are equal. Some deliver outsized ROI for B2B, while others play more of a supporting role. Here are benchmarks for ROI and key metrics across major digital channels:
- Email Marketing – The ROI Leader: Email remains the highest ROI channels in B2B. The average email marketing ROI is about $36–$45 for every $1 spent (15), depending on industry and execution quality. Well-run campaigns across newsletters, nurture sequences, and targeted outreach can consistently return 36x or more on spend. The economics are straightforward: distribution costs are low, targeting can be precise, and a well-maintained list compounds in value over time. Key email benchmarks:
- Open rate: In 2025, the average B2B email open rate was 43.5%, with a click-to-open rate of 6.8% (39). (Note: Apple’s Mail Privacy Protection has inflated this metric since 2021 by pre-loading images for Apple Mail users — which now accounts for ~46% of email clients. Treat open rate as a directional signal, not an absolute measure. Click-through rate and conversion are more reliable indicators of true engagement.)
- Click-through rate (CTR): ~2.0–2.1% across industries; B2B technology specifically benchmarks at ~2.5%
- Click-to-open rate (CTOR): ~6.8% the more reliable engagement metric post-MPP
- Unsubscribe rate: below 0.5% per campaign is considered healthy; spikes above that signal frequency or relevance issues
- Conversion rate from B2B email: ~2.4% (vs. 2.8% for B2C)
42% of B2B marketers rank email as their most effective channel for lead generation and nurturing (19), and 73% of B2B buyers say they prefer email as their primary channel for vendor communication (20). Focus optimization efforts on CTR and conversion rate rather than open rate alone, given the measurement distortion from privacy changes.
- SEO and Content Marketing – Long-Term High ROI: Search engine optimization and content remain the highest-ROI category in B2B marketing when measured over a 6–12 month window. They require upfront investment but can pay dividends over time.
A striking benchmark: thought leadership SEO campaigns (high-quality content targeting industry topics) can deliver 748% ROI with a ~9-month breakeven (6). In one analysis, B2B SaaS companies saw ~702% ROI from SEO efforts within 7 months (6).
More broadly, businesses on average earn $22 in revenue for every $1 spent on SEO (6). One structural shift worth tracking in 2026: organic search is evolving. Key benchmarks to watch: organic traffic growth (are your rankings bringing in steadily more visitors?) Organic search still accounts for roughly 30% to 60% of total B2B website traffic (21), the largest single source, but the nature of that traffic is changing asAI-powered search tools reshape how buyers discover content.
51% of B2B companies are increasing investment in Answer Engine Optimization (AEO) in response, compared to only 14% increasing traditional SEO spend (22). We cover this shift in detail in the AI Search section below. For conversion benchmarks: SEO traffic converts at approximately 2.6% for B2B, slightly above the overall website average. Content marketing’s lead generation impact remains strong, 76% of B2B marketers report content directly contributed to lead generation. Top teams accept the slower ramp on SEO because the long-term ROI eclipses paid channels by a significant margin.
- Pay-Per-Click Advertising – Quick Wins at a Cost: Paid search and social ads can deliver leads quickly, but benchmark ROI is more modest due to ad costs. For example, pay-per-click (PPC) campaigns often return around 36% ROI in the short run (10) – meaning for every $1 spent, you might get ~$1.36 back (a net $0.36 profit, or 36% gain).
That net ROI may sound low next to email or SEO, but remember PPC’s strength: targeting and speed. You can ramp campaigns up or down instantly and aim at specific account titles or keywords, which is valuable despite a lower efficiency.
Key paid channel benchmarks:
- Google Search Ads average a 3.04% conversion rate with a cost-per-click of around $2.69 (7).
- LinkedIn Ads (popular in B2B) see conversion rates of ~1.5–4.0% (7) and typically higher CPCs around $5–6 (11) given the professional audience.
- Facebook Ads surprisingly show high conversion (often ~10.6% for lead gen offers) at a lower CPC ~$1.72 (7), though Facebook leads might require more qualification.
Use these CPC and conversion benchmarks to judge your ad efficiency. If your LinkedIn ad CTR or conversion is much below the average, test new creatives or tighter audience targeting.
And watch cost per lead from ads: by channel, it can range widely (LinkedIn often highest, Facebook lower). The $200 overall CPL we mentioned can be broken down – e.g., LinkedIn might be $300+, Google $150, etc., depending on your industry. The key is ensuring the lifetime value (LTV) of customers from these ads well exceeds the acquisition cost. Top B2B teams often use PPC for quick pipeline boosts or targeting specific accounts (ABM ads), accepting a lower ROI but filling gaps that slower channels can’t.
- Social Media & Engagement – Indirect ROI With a Measurable Floor: Organic social media (like LinkedIn posts, Twitter engagement) is harder to tie directly to ROI, but there are benchmarks to gauge effectiveness. LinkedIn remains the dominant B2B social platform: 89% of B2B marketers use it for lead generation, and 62% say it produces leads effectively (23). Engagement rates on social media are generally low – an average LinkedIn engagement rate is about 2% (of your followers seeing a post) (7), while Twitter’s is ~0.05% and Facebook ~0.4% (7). If your corporate LinkedIn posts routinely exceed 2% engagement, you’re doing well relative to the benchmark. Although social ROI is often indirect (brand awareness, relationship building), you can track referral traffic and leads from social. For example, a benchmark might be that social contributes 5-10% of web traffic in B2B and a smaller fraction of leads. If yours is far below, it may indicate under-utilizing the channel. Also consider paid social benchmarks: we covered LinkedIn Ads; on Facebook, many B2B marketers focus on retargeting or lookalike audiences to keep ROI manageable. Top-of-funnel metrics like impressions and clicks are fine, but ensure you benchmark what actually matters – conversions from those social efforts.
- Webinars & Events, High Intent, Strong ROI: In recent years, webinars and virtual events have become key B2B lead generators. Benchmarks show webinars can achieve ~213% ROI on average (10). That is, more than double return on what you spend organizing and promoting the webinar. The value comes from high – intent leads who sign up. If you host webinars, track metrics like attendance rate (benchmark ~40–50% of registrants attend live) and post-webinar lead conversion (e.g., what percent request a sales follow-up or demo – anecdotally 5–20% can be a target). If your webinars aren’t hitting those engagement or ROI marks, consider improving content relevance or follow-up processes. Another common blind spot is not recording sessions — using reliable webinar recording software lets you analyze audience behavior later, share highlights with no-shows, and extract content for future campaigns.
In summary, B2B marketing ROI benchmarks vary by channel: Email and SEO often deliver the highest ROI (but need great content and lead lists), PPC delivers a faster pipeline at a lower ROI, and other tactics like social and webinars provide supporting lift when used strategically. The best practice is to use an omnichannel marketing approach – so that you’re capturing prospects efficiently at each stage. Many top teams will use content and SEO to build awareness (high ROI over time), email and social to nurture (high ROI and engagement), and targeted ads or outbound campaigns to trigger immediate conversations (filling pipeline gaps). As you evaluate your own marketing mix, compare your returns to these benchmarks and allocate budgets accordingly.
Engagement & Sales Efficiency Benchmarks
Top B2B teams turn 10–30% of MQLs into SQLs.
Reference Source: Martal Group
Beyond pure ROI, a few other benchmarks round out the picture of a high-performing B2B marketing engine:
- Marketing Qualified Lead (MQL) to SQL conversion: A common benchmark is that roughly 10–30% of MQLs turn into sales accepted leads (SQLs or opportunities) in high-performing teams (16). If your rate is consistently below 10%, the root cause is almost always one of two things: marketing is generating volume without qualifying intent, or sales and marketing are operating from different definitions of what a qualified lead actually is. Tightening those definitions, and aligning on ICP criteria, typically moves the number faster than any campaign adjustment. Top teams constantly refine lead scoring criteria to improve this handoff rate. The higher the percentage, the more efficient your funnel, it signals that marketing is delivering leads sales actually wants to work, rather than leads that get ignored or recycled.
- Lead response time: According to best practices, sales should follow up with inbound leads within minutes. Research from InsideSales consistently shows that a lead contacted within 5 minutes is 21x more likely to qualify than one contacted after 30 minutes (24), a gap that widens sharply as response time extends into hours or days. For most B2B teams, this is where earned leads quietly die. The fix is structural, not motivational. If your follow-up time is hours or days, that’s a gap to address (perhaps by using a fractional SDR team or outsourcing inside sales to ensure rapid response). This isn’t an “industry benchmark” per se, but a standard top performers adhere to for maximizing conversion of the leads you worked hard (and paid) to acquire.
- Marketing spend as a percentage of revenue: This high-level benchmark helps gauge if you are under-or over-investing in growth. The most current data shows B2B marketing budgets averaging 7.7% of total company revenue in 2025 (25), flat from 2024, and still below pre-pandemic levels. When segmented specifically for B2B organizations, Forrester places the average slightly higher at 8.4% of revenue (26). High-growth firms or SaaS companies might invest well above that (10–15%+ of revenue), whereas more mature or niche B2B firms might be below. If you’re significantly under the benchmark and still expecting big pipeline growth, it may not be realistic. On the flip side, if you’re spending above average but not seeing commensurate ROI, it signals inefficiencies. Industry context matters here, but the 8% figure provides a useful anchor for budget planning.
- Sales and marketing alignment metrics: As a softer benchmark, assess the level of alignment in your organization because it correlates with performance. For example, 93% of marketers feel a fully aligned sales and marketing team is vital for ABM success (8). The signal that alignment is missing rarely shows up in a single metric — it shows up as a pattern: low MQL-to-SQL conversion, high lead rejection rates, conflicting attribution reports, and finger-pointing between teams when pipeline targets are missed.
Each of these engagement and efficiency benchmarks ties back to ROI in the end – the faster you respond to leads, the higher your conversion; the more aligned your team, the better your ROI tracking and attainment. The next section looks at what top-performing B2B marketing teams are doing differently to consistently outperform these numbers.
With AI Search & AEO on the rise, traditional search volumes could decline 25% by 2026 as buyers increasingly use AI tools.
Reference Source: Gartner
There is a benchmark gap forming in B2B marketing, and most teams do not know they have it yet. While the metrics covered above (conversion rates, CPL, email ROI, pipeline contribution) remain essential, they collectively measure performance within a search and discovery model that is structurally changing.
Buyers are increasingly starting their research inside AI-powered tools, Claude, ChatGPT, Google AI Overviews, Perplexity, rather than executing a traditional search query and clicking through to a website. The scale of this shift is significant:
What This Means for B2B Marketing Benchmarks
The practical implication is that organic traffic volume is no longer a complete measure of search performance. A B2B team could be losing discovery share inside AI answers, where buyers are forming vendor shortlists before ever visiting a website, while their Google Analytics numbers look stable.
This is the retrieval gap: if your brand is not cited in AI-generated answers to the questions your buyers are asking, you are absent from an increasingly important stage of the buying journey.
The emerging discipline addressing this is Answer Engine Optimization (AEO), optimizing content so that AI systems can extract, cite, and surface it in response to buyer queries. It is not a replacement for SEO. It is an extension of it, built on the same foundations of content authority, structure, and relevance, but oriented toward citation rather than click.
Benchmark Indicators to Start Tracking
B2B teams at the leading edge are beginning to track a new set of visibility metrics alongside traditional channel benchmarks:
- AI citation share: How often does your brand appear in Claude, ChatGPT, Perplexity, or Google AI Overview responses to relevant buyer queries?
- Share of voice in AI answers: Across your target keyword clusters, what percentage of AI-generated responses reference your brand versus competitors?
- AI referral traffic quality: What is the conversion rate and engagement depth of traffic arriving via AI platforms?
- Content retrievability: Is your existing content structured in a way that AI systems can parse, extract, and cite accurately?
Adoption is still early, but the gap is opening. 70% of marketers believe AEO will significantly impact their strategy in 2026, yet only 20% have begun implementing it (31).
Among B2B companies, 51% plan to increase AEO investment in 2025, compared to only 14% increasing traditional SEO spend (22). For Martal clients specifically, this shift reinforces something we observe consistently in outbound programs: the buyers who respond to well-targeted outreach are increasingly arriving pre-informed.
They have already researched the category in AI tools before a cold email or LinkedIn message lands. That makes the quality of your brand’s AI presence, what gets said about you before a human ever touches a prospect, a meaningful upstream variable in outbound conversion rates.
The operational takeaway is not to abandon traditional benchmarks. It is to add AI visibility as a parallel tracking category, and to ensure that the content assets supporting your demand generation programs are structured to perform in both traditional search and AI-generated discovery.
How Top B2B Marketing Teams Outperform the Benchmarks
Companies using ABM are 60% more likely to meet revenue goals.
Reference Source: G2 Learn
Top-performing B2B marketing teams don’t settle for “average” – they consistently beat benchmarks by combining data-driven focus with strategic investments. What are they doing differently? Research and surveys point to several habits and strategies common among the best performers:
- They align marketing with business goals and measure what matters. 68% of the top-performing B2B marketers set clear goals aligned to their organization’s objectives (5), and 61% of the best performers say they effectively measure content performance (5). The practical result is a tighter reporting structure, and marketing leaders who align their dashboards to those metrics secure budget and trust more reliably than those presenting channel-level vanity data. They avoid vanity metrics; instead, they double down on metrics like conversion rates, SQLs, and marketing-sourced revenue. This focus creates a culture of accountability and continuous improvement. By reporting the metrics senior leadership cares about (often just 2–3 key metrics go to the board (2)), they secure buy-in and budget to keep optimizing ROI.
The 5 metrics that matter most to marketers heading into 2026: lead quality and MQLs (39%), lead-to-customer conversion rate (34%), ROI (31%), customer acquisition cost (30%), and lead generation volume (29%) (4).
- They deeply understand their target audience. It may sound basic, but it’s a defining trait: 82% of top B2B marketers attribute their success to understanding their audience extremely well (9). The operational implication is that they do not benchmark against industry averages in isolation, they segment performance expectations by persona, company size, and funnel stage. These teams invest in research to refine their ideal customer profiles(ICPs) and buyer personas. They segment benchmarks by audience when possible – for example, knowing that conversion rates for C-suite prospects might differ from manager-level prospects, they tailor their approach accordingly. Customer insights also inform better personalization (notably, 73% of marketers say ABM helps increase deal size by focusing on lead quality (8), which hinges on knowing your audience).
- They leverage ABM and targeted campaigns. ABM has crossed from early-adopter territory into mainstream B2B strategy: 57% of B2B marketers are now planning or executing ABM programs, with 52% reporting positive ROI (29). Companies using ABM have 60% higher success rates in reaching their goals (8). By focusing on quality over quantity (targeting specific high-value accounts with personalized outreach), they achieve higher conversion and ROI benchmarks. For instance, ABM practitioners often see better engagement: one study found 84% of companies saw pipeline growth as a result of ABM strategies (8). The takeaway: leaders are outpacing benchmarks by not relying on spray-and-pray tactics. Instead, they concentrate resources on the best-fit prospects and thus drive up metrics like lead-to-deal conversion and average deal size (some report 200%+ increases in marketing-sourced revenue after ABM adoption (8)).
What this looks like in practice. In one Martal engagement with a financial services company, a focused account-based outbound strategy produced 2,316 leads and 832 meetings over three years (32), a volume and quality level that broad-based prospecting had consistently failed to achieve. The shift was not in channel or spend, it was in targeting precision.
- They invest in high-quality content and thought leadership. The distinction between average and high-performing content programs is not volume, it is how content is measured. 77% of top B2B marketers say producing high-quality content is key to their success (9). Quality content (blogs, whitepapers, webinars, case studies) fuels SEO ROI, improves email engagement benchmarks, shortens sales cycles, and provides SDRs with credible assets to reference in outreach. Buyers who rate vendor content as “extremely influential” are 131% more likely to purchase (29), which is why content investment, done well, shows up in conversion rate benchmarks, not just traffic metrics.
- They optimize the funnel relentlessly and use technology smartly. High achievers treat benchmarks as a starting point and then run experiments to raise the bar. They A/B test landing pages to push conversion rates above the usual 2-5%. They invest in AI-driven tools to close execution gaps at scale: AI-driven lead scoring to improve MQL-to-SQL conversion rates, intent data platforms to prioritize outreach timing, and multi-touch attribution models to identify which channel combinations are actually driving pipeline. 91% of B2B tech marketers now use intent data to prioritize accounts (8), and nearly 47% of marketers plan to expand AI use in their strategies in the near term (33). The teams pulling away from benchmarks are not doing so through effort alone, they are building systems that make outperformance repeatable rather than dependent on individual execution.
- They build structural alignment between sales and marketing, and measure it. It’s worth reiterating how often alignment comes up in research: 93% of marketers say sales/marketing alignment is vital (8), and companies with aligned teams see markedly better outcomes (for example, one stat shows aligned ABM strategy companies enjoyed 208% revenue increases over 3 years (8)). Without that feedback loop, marketing optimizes for lead volume and sales complains about lead quality — a cycle that wastes budget and creates organizational friction without improving any benchmark. This ensures that marketing efforts translate effectively into the sales pipeline. In practical terms, an aligned team will have higher lead acceptance rates and faster follow-ups – thus surpassing benchmarks for SQL conversion and pipeline velocity.
In summary, top B2B marketing teams outperform benchmarks by being intentional, data-driven, and customer-centric. They do not treat benchmarks as the goal, they treat them as the floor. If the average email ROI is 36:1, they strive for 40:1 by refining their segmentation and content. If the industry is just discovering AEO, they are already tracking AI citation shares. They regularly review benchmark data and ask, “How can we do better?” This mindset, coupled with strategic choices (ABM, great content, alignment), is what lets them continuously outpace the pack.
As a B2B leader, you can borrow these habits: set aggressive but realistic goals, ensure you’re measuring the right things, and focus on quality in both your tactics and your team collaboration. Next, we’ll discuss how to apply all these benchmarks to your own planning and improvement efforts.
Using Benchmarks to Drive ROI Improvement & Pipeline Planning
B2B marketing budgets average 7.7% of total company revenue in 2025.
Reference Source: Gartner
Knowing the benchmarks is the starting point, acting on them is where ROI is actually made. Here is a practical framework for turning benchmark data into decisions:
- Set target benchmarks for your team. Rather than setting a single benchmark target, build a tiered framework: a floor (the industry average you must clear), a healthy target (where strong programs operate), and a stretch goal (top-quartile performance).
- For website conversion: floor at 1.8%, healthy target at 3–5%, stretch above 5%.
- For MQL-to-SQL: floor at 10%, healthy target at 20–25%, stretch above 30%.
- For marketing-sourced pipeline: floor at 30%, healthy target at 40–50%, stretch above 60%.
By translating benchmarks into tiered objectives, you give your team clear thresholds and a direction of travel, not just a number to hit. Ensure these targets are integrated into your dashboards and weekly metrics reviews. It creates a performance-driven culture where everyone knows what “good” looks like. Martal often uses this approach with clients: we review key metrics at the outset and establish target lead generation KPIs (like CPL, conversion rate) that exceed the norm, then design campaigns to hit those marks.
- Forecast outcomes and budget needs. Benchmarks are among the most underused planning tools in B2B marketing. The math is straightforward once benchmarks are plugged in. If you need $5M in new revenue, your average win rate is 20%, and marketing sources 30% of pipeline, you need approximately $25M in total pipeline, of which $7.5M must come from marketing. If the average lead-to-opportunity conversion is 10%, you’ll need 10x more raw leads than opps. Very quickly, benchmarks for conversion rates and deal size help you determine “how many leads do we need, at what cost, to hit $5M in sales?” From there, ensure your marketing budget is sufficient by using cost per lead benchmarks. If you need 1,000 leads and CPL is ~$200, that’s $200k spend required. Compare that to your available budget. If it falls short of the projection, the conversation shifts from ‘justify your spend’ to ‘which targets need adjusting?’, a fundamentally more productive discussion.
- Identify weak spots and prioritize improvements. The most common mistake in benchmark-driven optimization is treating the funnel as a single unit. Benchmark each stage separately: traffic volume and source mix, visitor-to-lead conversion, lead-to-MQL rate, MQL-to-SQL rate, SQL-to-opportunity rate, and close rate. The stage that falls furthest below benchmark is almost always where the leverage is. By benchmarking each major metric – traffic, conversion, CPL, SQL rate, win rate – you can zero in on the one or two areas that will most improve overall ROI. It’s often depicted as “inspect what you expect” (2) in revenue management: measure each outcome so you know where to intervene. If your CTR on email is below the 2.0–2.1% benchmark (34), invest in content relevance and offer clarity, not send frequency.
If your website converts below 1.8% (35), address targeting and messaging before increasing ad spend. If paid CPL is running at double benchmark, shift budget toward higher-ROI channels like email, SEO, or outbound campaigns until the paid program is recalibrated.
Benchmarks are most valuable not as targets but as diagnostic tools — they tell you precisely where your funnel is underperforming before you decide where to invest.
- Benchmark against yourself over time. Industry benchmarks are useful, but your own historical performance is also a benchmark. Track how your key metrics trend year over year. For example, if last year your marketing-sourced pipeline was 25% and this year it’s 40%, that’s a huge improvement even if the industry average is 30%. Continual improvement relative to your baseline is the ultimate goal. Combining this with external benchmarks gives you a full picture: are we catching up to/exceeding the industry, and are we better than we used to be? Many companies create a ‘benchmark report’ annually to present to executives, highlighting both internal progress and market position. Add AI visibility metrics to this report now, teams that begin tracking AI citation share and share of voice in AI-generated answers in 2025/2026 will have a meaningful head start when these benchmarks become standard practice (22).
- Incorporate benchmarks into sales and pipeline planning. The most productive benchmark conversation between sales and marketing happens before the quarter starts, not during a pipeline review where someone is defending a number. Educate your sales counterparts: for example, “Typically, it takes 100 marketing leads to produce 10 opportunities and 2 deals, based on our 10% lead-to-opp and 20% win rate benchmarks. So to hit your 50-deal quota, we need to generate roughly 2,500 leads this year.” This ties marketing activity directly into pipeline and revenue plans. It also highlights where joint improvements can raise the bar – if together you can improve the win rate from 20% to 25% (perhaps via better lead nurturing or sales enablement), it reduces the number of leads needed. When both teams agree on those definitions upfront, benchmarks stop being a source of conflict and start being a shared planning language. Quarterly pipeline reviews should compare actual conversion rates against agreed benchmarks and use the gaps to drive the next quarter’s priorities, not to assign blame for the last one.
- Leverage external partners and tools when below the benchmark. If specific benchmarks remain persistently out of reach despite internal optimization, particularly in outbound prospecting, it is worth examining whether the problem is execution capability rather than strategy.
76% of B2B marketing decision-makers say outsourced support helps them meet business objectives(36), and in 2026, faster execution has overtaken specialized expertise as the primary reason companies bring in external partners. If your cold emails are not converting, your appointment rates are below benchmark, or your pipeline contribution from outbound is consistently under 30%, an outsourced lead generation partner can inject proven omnichannel processes to close the gap faster than rebuilding internally. (We often hear from clients who were converting very low on their cold outreach; by adopting our omnichannel approach, they quickly rose to industry-standard appointment rates or higher.) The principle: benchmarks identify where you need help. The decision about whether to build, buy, or partner to close the gap is a separate but equally important question.
- Celebrate and publicize benchmark-beating achievements. When your team outperforms a benchmark — marketing sourcing 50%+ of pipeline, CPL running 20% below industry average, MQL-to-SQL conversion hitting 30%, document it, report it upward, and use it as the baseline for the next planning cycle. Publicizing such achievements internally (and even externally, in marketing case studies or PR) can strengthen the marketing team’s credibility. It reinforces a positive feedback loop – leadership sees marketing not just keeping up with benchmarks but surpassing them, which often leads to more trust and potentially more budget to continue the momentum. It’s also motivating for the team to know they are outperforming the norm. Just be sure to continually recalibrate benchmarks as you grow; today’s stretch goal can become tomorrow’s baseline.
The teams that outperform benchmarks consistently are not the ones that achieved a number once, they are the ones that built a system for continuously raising their own standard.
By now, it’s clear that the benchmark is not the goal, outperforming it is. The teams covered in this guide are not exceptional because they tracked more metrics. They are exceptional because they built systems that turned benchmark gaps into specific decisions: where to invest, what to fix, and when to bring in reinforcement. With the right benchmarks in hand, you can confidently steer your marketing efforts to achieve higher ROI and fuel your sales pipeline.
As you benchmark and optimize your 2026 pipeline programs, remember that you don’t have to do it alone. Martal Group’s team specializes in helping B2B companies exceed these industry benchmarks. We bring an omnichannel outbound salesstrategy – blending cold email, LinkedIn outreach, and cold calling – to maximize your lead generation ROI across every channel. Our tiered services (from dedicated appointment setting to full sales outsourcing) give you a flexible, expert-driven approach to consistently fill your pipeline with qualified opportunities.
Book a consultationwith Martal Group today, and let’s discuss how to apply these benchmarks to your business for tangible revenue growth. We’ll candidly evaluate your current outreach metrics and show how our data-driven tactics can boost your conversion rates, lower your CPL, and ultimately drive more ROI from your marketing investment. With Martal’s experienced onshore SDR teams and our proprietary AI SDR Platform, you can turn benchmark insights into action – and join the ranks of the top B2B teams outperforming the competition. Contact us now to start outperforming industry benchmarks and accelerating your pipeline in 2026.
References
- Forrester
- 6sense
- Demandbase
- HubSpot
- WebFX
- Scopic Studios
- ProperExpression
- G2 Learn
- Amra & Elma
- Data Mania
- Hubble
- Abacum
- Amplitude
- Tooltester
- Martal Group – MQL vs SQL
- Gartner
- SERPsculpt
- SaaS Hero
- Allegrow
- Media Post
- Volcano Marketing
- The Digital Bloom
- InsideSales
- Gartner’s CMO Spend Survey
- Forrester
- TechCrunch
- Bain & Company
- KLIQ Interactive
- Depthera
- Acquia via Aspiration Marketing
- Martal Group Case Study
- Data-Mania
- Powered by Search
- Predictable Profits
- Forrester via Bruce Clay
- SalesHive
- Wingfy
- MailerLite
FAQs: B2B Digital Marketing Benchmarks
What are the top B2B digital marketing benchmarks for ROI?
Top ROI benchmarks include an average B2B website conversion rate of 1.8%, with a healthy target range of 3–5%, $200 average CPL, email marketing ROI of $36–$45 per $1 spent. SEO and content campaigns can return $20+ per $1 invested, while paid media (PPC) averages around 36% ROI in the short run, with LinkedIn delivering the only consistently positive ROAS (~113%) among major B2B ad platforms (37).
Strong programs also convert 50–60% of MQLs to SQLs” → “Strong programs convert 10–30% of MQLs to SQLs, with top-quartile teams pushing toward the upper end (15) and source 30–60% of total pipeline from marketing (12). In 2026, top teams also track a new benchmark category: AI search visibility — including brand citation share across ChatGPT, Google AI Overviews, and Perplexity (22).
How do B2B digital marketing benchmarks differ from B2C benchmarks?
B2B benchmarks reflect longer sales cycles, higher CPLs, and lower conversion rates due to narrower audiences and complex purchase decisions. For example, B2B CPLs average $200+, while B2C can be under $50. B2B websites convert at an average of 1.8% (35), compared to 2.1–2.5% for B2C sites (38), a gap that reflects B2B’s longer decision cycles and higher average transaction values.
What is Answer Engine Optimization (AEO) and why does it matter for B2B marketing benchmarks?
AEO (Answer Engine Optimization) is the practice of structuring content so that AI-powered tools like Claude, ChatGPT, Google AI Overviews, and Perplexity can extract, cite, and surface it in response to buyer queries. It matters for B2B marketing benchmarks because traditional search traffic metrics are becoming an incomplete measure of digital visibility. B2B teams that begin tracking AI citation share and brand visibility in AI-generated answers now will have a meaningful competitive advantage as this benchmark category matures.
Why are B2B digital marketing benchmarks important for sales and pipeline planning?
Benchmarks provide realistic expectations for lead volume, conversion, and ROI—critical for aligning sales and marketing goals. They help forecast how many leads are needed to meet revenue targets, determine budget requirements, and optimize team resourcing. For example: with a 10% lead-to-opportunity rate and a 20% win rate, hitting a 50-deal quota requires generating 2,500 raw leads, at the $200 CPL benchmark, that is $500K in marketing spend. Benchmarks make that math visible, defensible, and shared between sales and marketing before targets are set — not after they are missed.